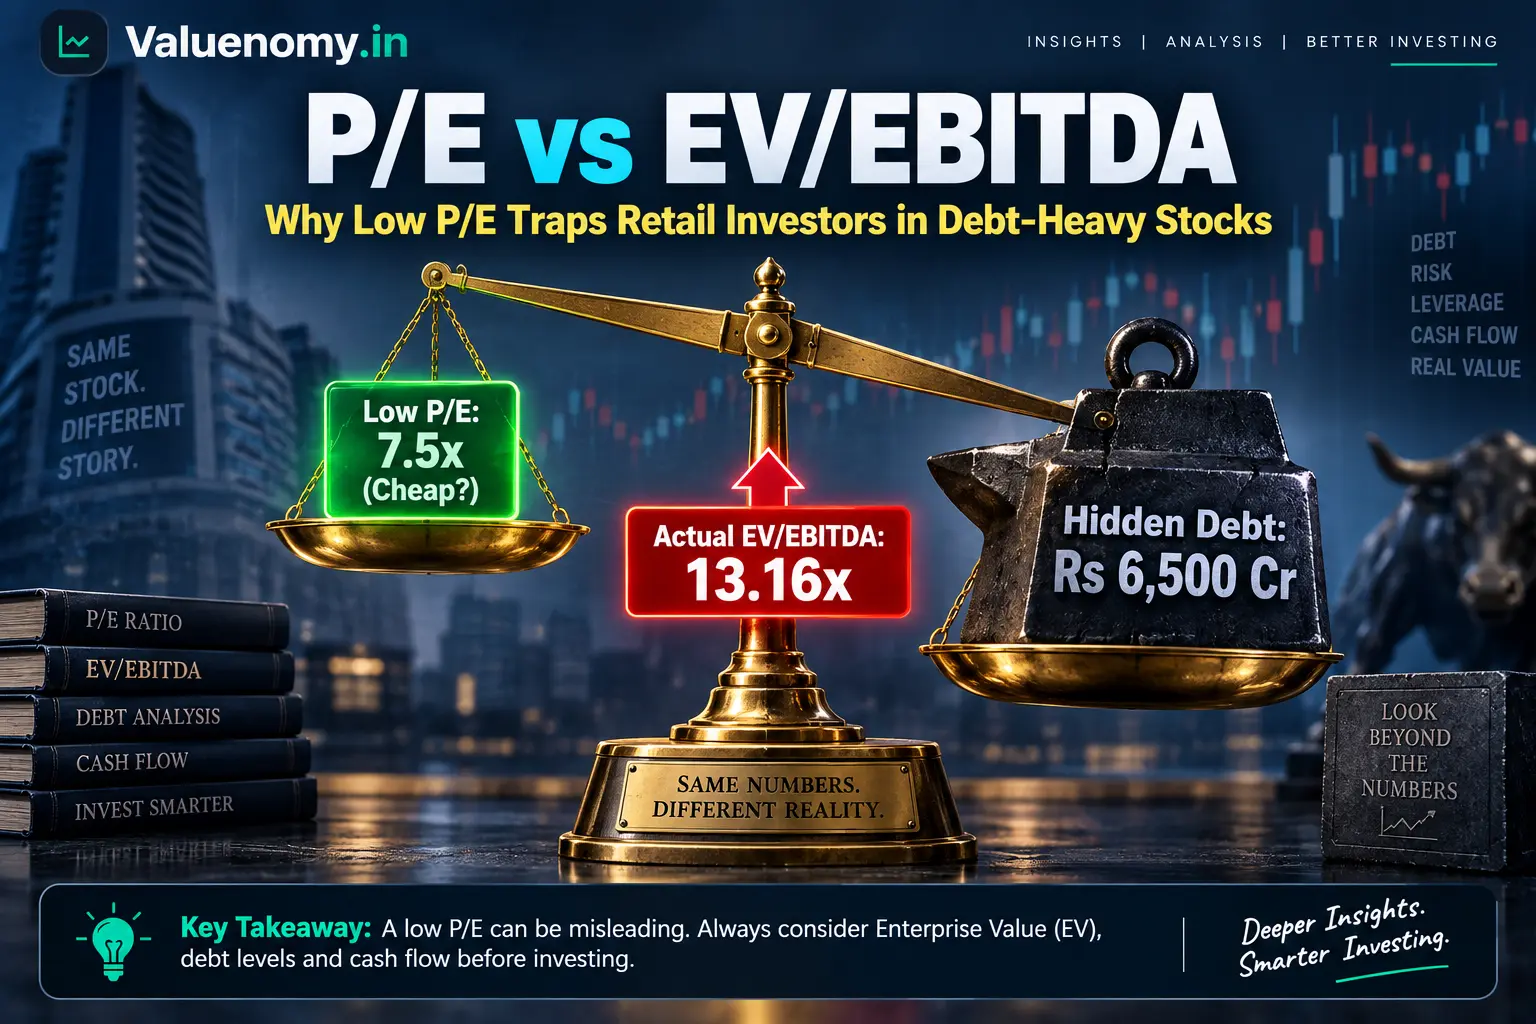
P/E vs EV/EBITDA: Why Dalal Street’s Favorite Multiple Traps Retail Investors in Debt Laden Stocks
- Valuenomy Research
- Valuation Guides
- 19 Sep, 2026
The Optical Illusion of Cheap Earnings on Dalal Street
Among retail investors, the Price to Earnings ratio is the most popular metric to judge the relative valuation of a stock. From financial news channels to mobile trading platforms, a discussion about low P/E stocks and high P/E stocks is ubiquitous. Any stock that trades at a low single-digit P/E is automatically considered as a value buy, whereas the opposite is true for stocks that trade at a high P/E. This widespread misunderstanding about the relevance of the P/E ratio creates one of the most common wealth-destroying traps for individual investors on the Indian equity market. When it comes to capital-intensive businesses like steel, infrastructure, power, and telecom, the P/E multiple is a misleading indicator of the fundamental value of a stock.
On the other hand, institutional investors utilize the comparison between P/E vs EV/EBITDA to identify value traps and unearth cheap stocks that have the potential to compound at a healthy rate over time. One should understand the critical difference between Equity Value and Enterprise Value to appreciate why the discussion around P/E vs EV/EBITDA is so relevant to value-conscious Indian equity investors.
Understanding Equity Value and Enterprise Value
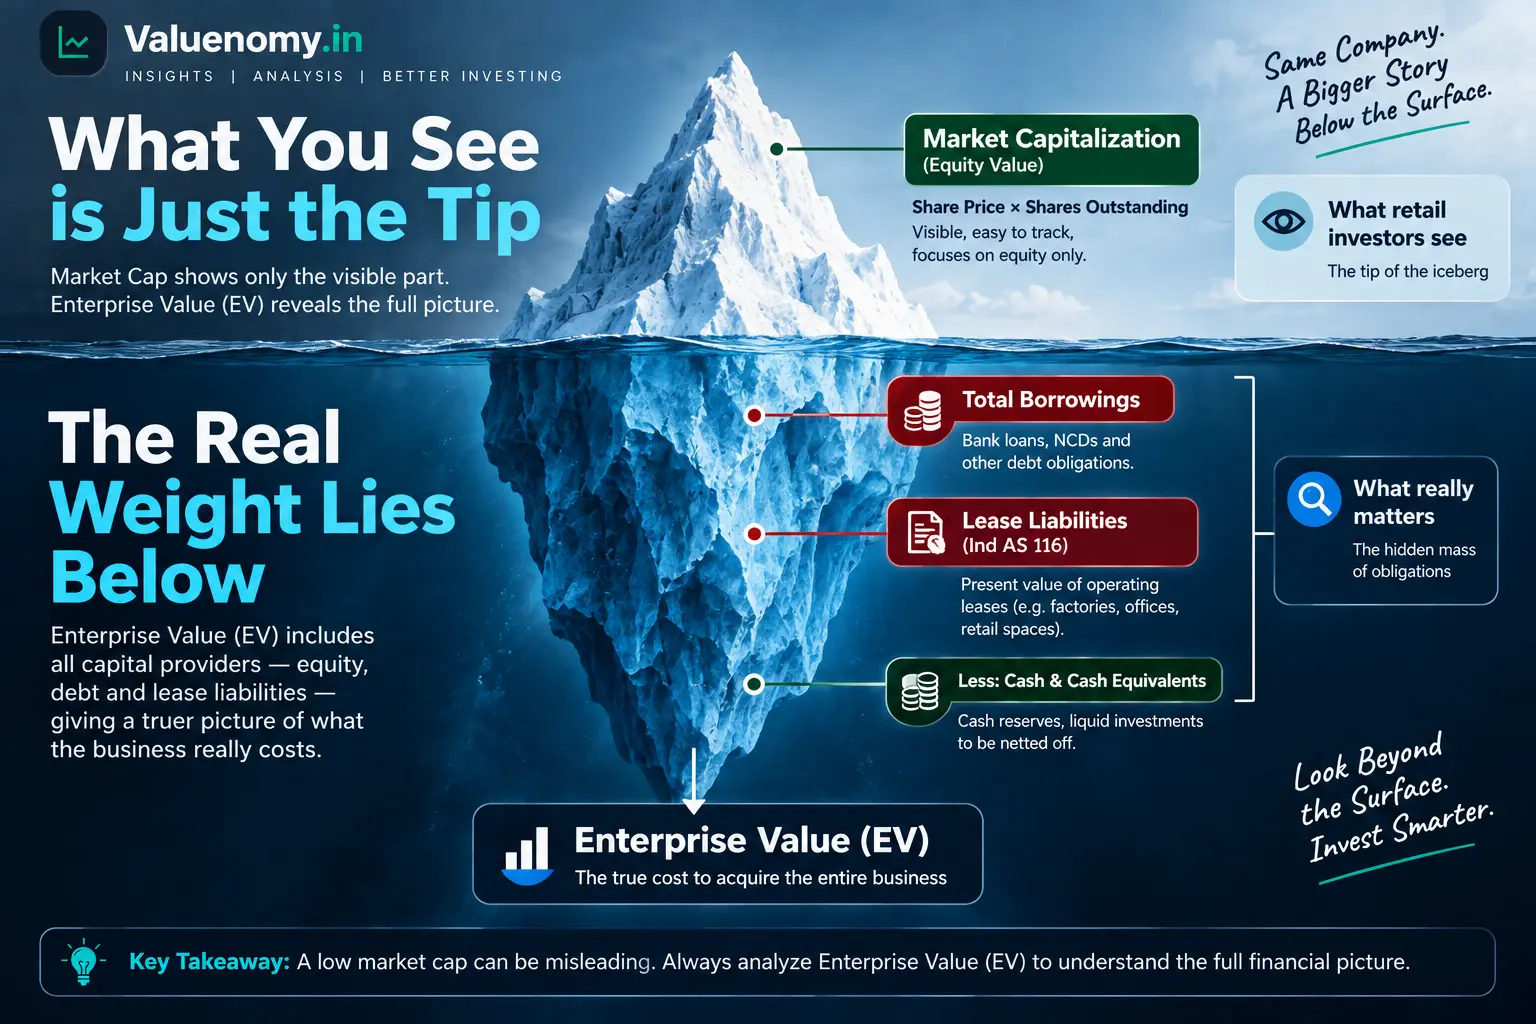
To understand the nuance between P/E vs EV/EBITDA, one must first be familiar with the basic difference between Equity Value and Enterprise Value.
The Price component of the P/E ratio is simply the Market Cap of the listed entity arrived at by multiplying the share price with the number of outstanding shares. Market Cap, in turn, represents the aggregate value of all the equity shareholders’ claim on the company’s assets and cashflows after meeting the obligations to all the other stakeholders including debenture-holders, financial institutions, and tax authorities. On the other hand, Enterprise Value or EV is the price an acquirer would pay to buy all the shares of the target company. When one buys 100% of the equity shares of a company, one owns all the assets controlled directly or indirectly by the target company. In other words, one acquires all the cash and cash instruments while assuming the responsibility of paying off all the debts and liabilities of the target company. Therefore, the formula for Enterprise Value is as follows:
Enterprise Value = Market Cap + Total Borrowings + Lease Liabilities – Cash & Cash Equivalents – Liquid Investments
With the implementation of Indian Accounting Standard (Ind AS) 116 Leases, the calculation of Enterprise Value has become even more relevant and accurate. Previously, operating lease commitments were not included in the calculations of total debt obligations on the balance sheet of the lessee. With the new accounting standards, operating lease liabilities have been bifurcated from lease rentals and have been added to gross debt obligations as right-of-use assets.
Why Debt Obligations Make the P/E Multiple Look Cheap
Companies that finance their large-scale capital expenditures through debt obligations end up with significant interest expenses that dramatically impact their bottom-line performance. Under Indian tax laws, companies can claim tax deductions on the interest payouts made to lenders and debenture-holders. Therefore, when the revenues of such companies begin to rise during a recovery phase, their Net Profit After Tax explodes due to the interaction of operating leverage and financial leverage. An 8% increase in revenues translates to a 40% increase in earnings per share if the operating and financial expenses remain constant.
When a retail financial analyst observes the given example, he/she might be tempted to short-sell the stock of the given company. A drop in the P/E ratio from 25x to 7x would suggest that the stock has turned cheap on a trailing basis. In reality, the given company might have an unbelievably high amount of debt obligations on its balance sheet.
During a downturn, the operating revenue declines by 8%, leaving the company with insufficient cashflows to meet its interest obligations. As a result, the Net Profit After Tax collapses, often registering a negative value, thereby shooting the P/E ratio to infinity or negative territory. P/E vs EV/EBITDA comparisons are useful to understand the true capital intensity of a business. While the EBITDA of the target company remains constant regardless of the capital structure, the EV/EBITDA multiple reflects the amount an acquirer would pay to buy the operating cashflows of the target firm.
4 Ways In Which P/E Screener Falls Short For Leveraged Counterparties
Total Obliviousness To Solvency Risk
If a company with a market cap of Rs 1,000 crore records a Net Profit of Rs 125 crore, it would be considered as a cheap stock that trades at a P/E multiple of just 8x. However, if the given company records total borrowings of Rs 5,000 crore in its balance sheet, the Enterprise Value of the target company would be Rs 6,000 crore. By buying the equity shares of the target company, an individual investor would own a business with an asset-liability mismatch of 1:5. A P/E screener would have failed to highlight this crucial detail.
Divergences in Depreciation And Asset Replacement Cost
According to Schedule II of the Companies Act, 2013, companies can determine the useful life of their machinery, plant, and infrastructure assets. Unscrupulous management can take advantage of this provision and record lower depreciation expenses to report higher profits on their income statements. By artificially reducing the depreciation expenses, the management of a target company could make its P/E ratio artificially low. In order to avoid falling for such valuation manipulations, one should compare the P/E vs EV/EBITDA multiples of a target company.
Working Capital And EBITDA Distortion Risks
While P/E and EV/EBITDA ratios do not consider working capital, the former is much more susceptible to working capital manipulations such as channel stuffing. When an Indian listed company engages in channel stuffing, it artificially increases its trade receivables, which, in turn, benefits the income statement through higher revenues and profits. In order to avoid such working capital manipulations, one should always compare the P/E ratio to the EV/EBITDA ratio.
Distortions From Non-Operating Income
Net Profit After Tax figures are susceptible to adjustments arising from windfall profits and foreign exchange gains. On the other hand, EBITDA is a clean indicator of operating performance, free from any distortions relating to interest costs, depreciation, and amortization.
The Value Trap Vs The True Bargain: A P/E vs EV/EBITDA Practical Example
In the following example, let us analyze the valuation multiples of two steel companies that report the same net profit but use divergent financing methods to fund their capital expenditures.
| Metric / Parameter | Company Alpha: The Optical Value Trap Company | Company Beta: The Real Bargain Counterparty Company |
|---|---|---|
| Share Price | Rs 150 | Rs 400 |
| Outstanding Shares | 10 crore | 10 crore |
| Market Cap | Rs 1,500 crore | Rs 4,000 crore |
| Net Profit | Rs 200 crore | Rs 200 crore |
| P/E multiple | 7.5x | 20x |
| Total Debt | Rs 6,500 crore | Rs 200 crore |
| Cash | Rs 100 crore | Rs 700 crore |
| Enterprise Value | Rs 7,900 crore | Rs 3,500 crore |
| EBITDA | Rs 600 crore | Rs 500 crore |
| EV/EBITDA multiple | 13.16x | 7x |
Based on the P/E metrics, Company Alpha appears to be a better value buy as compared to Company Beta. However, a close analysis of the EV/EBITDA multiple suggests that Company Beta is significantly cheaper on a cash-flow basis.
P/E to EV/EBITDA Transition: The Relevant Accounting And Regulation
When it comes to the analysis of P/E vs EV/EBITDA, it is necessary to comment on a few Indian accounting standards and regulations that have a direct bearing on the given topic:
India-specific Accounting Standards
The Institute of Chartered Accountants of India issued Ind AS 116 Leases, which requires entities to account for all lease agreements by recognizing an asset and a liability on the balance sheet. Operating leases, which were previously treated as off-balance sheet financing arrangements, are now included in total debt obligations when measuring EV.
India-specific Regulatory Framework
The Securities and Exchange Board of India’s Issue of Capital and Disclosure Requirements (ICDR) Regulations ensure that SEBI-registered entities follow uniform accounting and disclosure standards when issuing capital. The given regulation touches upon Net Asset Value calculations, as well as the Debt to Equity guidelines for listed firms.
India-specific Banking Guidelines
The Reserve Bank of India’s guidelines on Stressed Asset Management set out the framework within which commercial banks should operate while dealing with defaulting borrowers. The given framework is relevant to the discussion on P/E vs EV/EBITDA as it covers Debt-Service Coverage ratios and Debt to EBITDA norms.
India-specific Corporate Governance Rules
The Ministry of Corporate Affairs oversees the implementation of the Companies Act, 2013 in India. The given Act covers the format of balance sheets and income statements of all registered firms.
How To Use P/E, EV, and EBITDA To Screen Cheap Stocks
As a retail value investor, one must avoid screening cheap stocks on the basis of the P/E ratio alone, as the metric fails to account for financial leverage. Instead, one should consider the following principles when screening for value stocks:
- Principle 1: Invert The Screening Process
Instead of screening for stocks with low P/E ratios, one should use the EV/EBITDA multiple as a stock screening criterion. Ideally, one should look for stocks with EV/EBITDA multiples of less than 10x and Net Debt/EBITDA ratios of less than 1.5x.
- Principle 2: Compare The P/E Multiple To The EV/EBITDA Multiple
When it comes to the discussion on P/E vs EV/EBITDA, one should look out for divergences between the two valuation multiples. If the P/E ratio of a stock is low while its EV/EBITDA multiple is high, it is a sign that a company’s financial leverage is artificially depressing its P/E ratio.
- Principle 3: Recalculate The Real Enterprise Value
One should be wary of contingent liabilities that are not captured in the balance sheet of a target company. In the EV calculation, one should add the present value of leases mentioned in the footnotes and any corporate guarantees issued by the target firm to its subsidiaries. The given adjustments to the Enterprise Value are especially pertinent in the case of financially stressed listed firms.
- Principle 4: Avoid Averaging Down On Value Traps
During a cyclical downturn in commodity prices, many investors give up on capital-goods stocks that have taken a beating during the selloff. Many investors attempt to average down on their purchase price, without realizing that the operating cashflows of the target firm may no longer be able to meet its interest obligations. When in doubt, one should use the Valuenomy Stock Average Calculator to determine the maximum price that one should be willing to pay to average down on the stock.
Frequently Asked Questions
Why does a high debt burden make the P/E ratio look deceptively cheap?
Large-scale borrowing creates significant interest expenses that reduce the bottom-line profits of a company. At the same time, interest payments on debt are eligible for tax deductions, which means that companies reduce their tax liability when they record interest expenses. As a result, when the revenues of a highly leveraged company rise, its Net Profits tend to skyrocket, thus making its P/E ratio artificially cheap.
When is EV/EBITDA superior to P/E ratio for evaluating Indian stocks?
EV/EBITDA is a superior metric to evaluate the relative valuation of stocks in India. It is an especially useful yardstick to evaluate the stocks of capital-intensive, cyclical, and leveraged stocks in the metal, infrastructure, and power sector.
Can one apply the EV/EBITDA principle to value financial institutions?
No, the EV/EBITDA principle cannot be applied to financial institutions as they do not have significant capital expenditures. The operations of banks and non-banking financial companies are largely driven by their borrowing costs and net interest margins.
How has Ind AS 116 changed the way Enterprise Value is calculated in India?
Ind AS 116 has modified the calculation of operating leases in India by recognizing them as assets on the balance sheet of the lessee. In other words, operating leases are treated as financial liabilities under the Ind AS 116 accounting standards.
What is a safe Net Debt to EBITDA ratio in India?
A Net Debt to EBITDA ratio of 3.0x is bad for the credit profile of any listed firm in India.

Valuenomy Research
Capital Markets & Valuation DeskValuenomy Research Desk is comprised of certified financial analysts focusing on DCF valuation modeling, Indian direct taxation analysis, and quantitative equity risk management.
View Editorial Profile & MethodologyRegulatory Compliance & Statutory Disclaimer
The financial models, valuation projections, brokerage summaries, and target estimations presented on Valuenomy are curated solely for academic research, mathematical evaluation, and investor education purposes.
Valuenomy is not a SEBI-registered investment advisor or research analyst. Securities markets are subject to high market risks. Always review underlying corporate filings and consult an authorized SEBI-registered financial advisor before executing capital decisions.