EBITDA to CFO Divergence: How Indian Companies Fake Operating Cash Flow Guide
- Valuenomy Research
- Valuation Guides
- 14 Sep, 2026
The Accrual Accounting Trap and the Mechanical Bridge
In the Dalal Street, few metrics are so frequently celebrated and dangerously misleading compared to Earnings Before Interest, Taxes, Depreciation, and Amortization (EBITDA). Promoters, investment bankers, and television analysts routinely parading operating profitability as proof of robust health. However, EBITDA is an accrual accounting concept. It records revenues when invoiced and expenses when incurred, irrespective of whether a single rupee of hard cash has crossed the corporate bank counter.
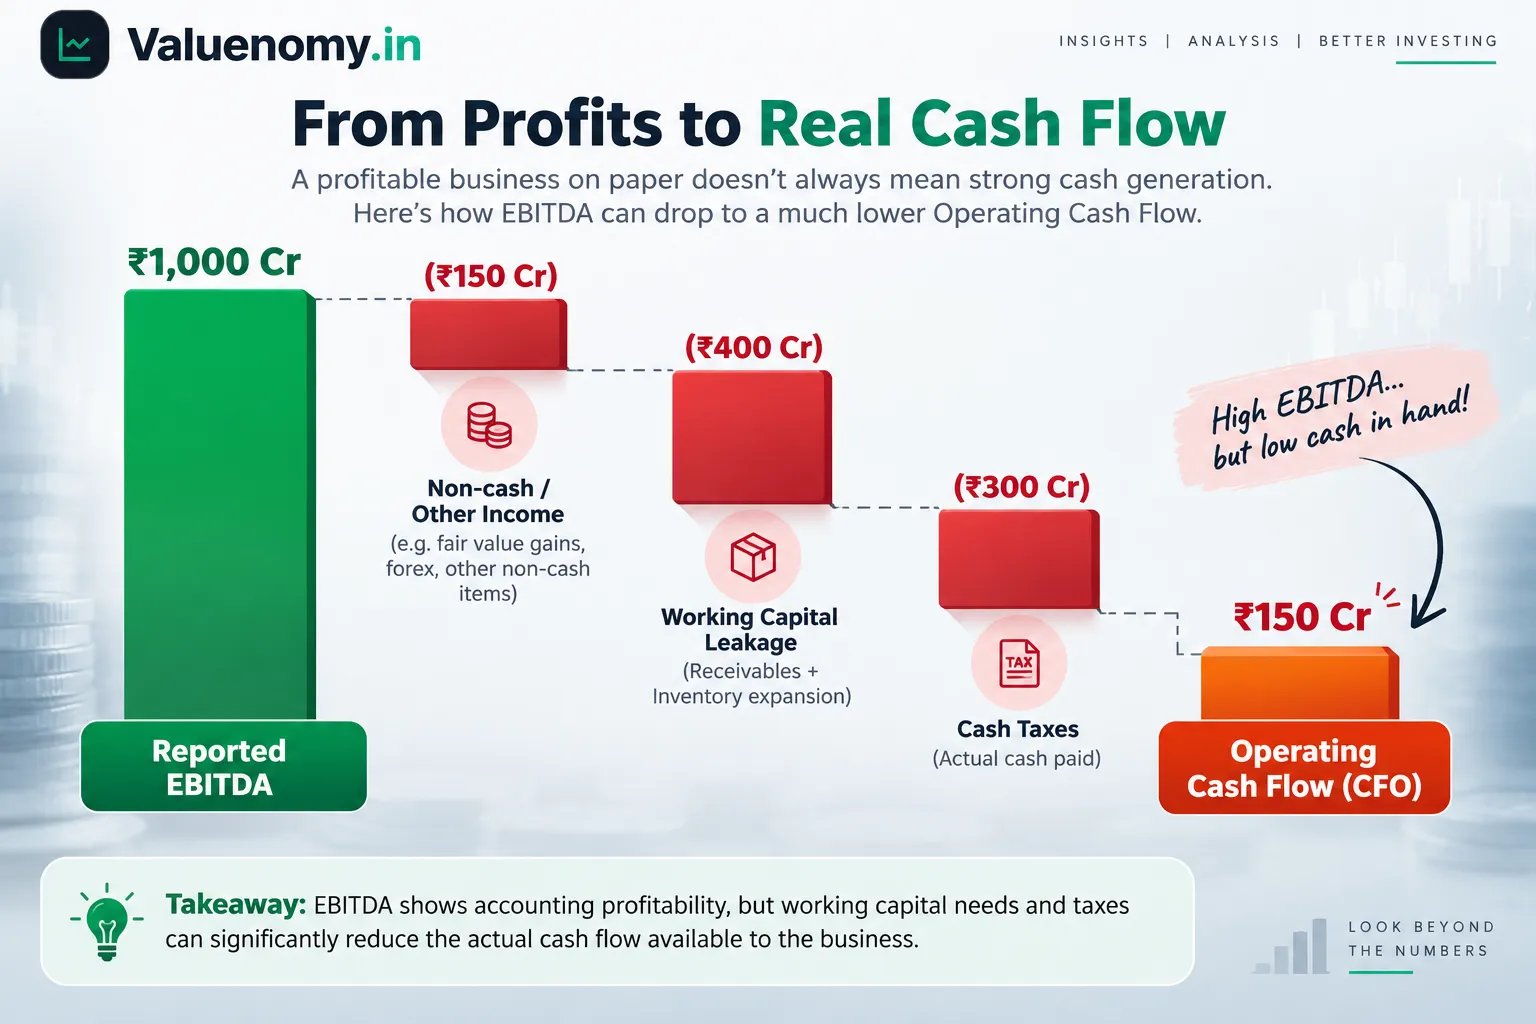
The health of an operating business is governed strictly under Indian Accounting Standard (Ind AS) 7. The mechanical bridge from EBITDA to CFO takes away the accounting optimism. Starting from EBITDA, one must adjust the non-cash line items, deduct the real cash income taxes paid and crucially, add or subtract the changes in working capital assets and liabilities.
Bridge operates in a simple mechanical manner:
CFO equals EBITDA minus Non-Operating Other Income minus Working Capital Drag minus Direct Cash Taxes Paid.
Working capital drag comprises of increase in trade receivables plus increase in inventories minus increase in trade payables. Where aggressive management teams bury their operating rot, working capital drag is where this happens. When a company claims its operating profit grew by 25 percent, but its trade receivables and unsold inventory surged by 60 percent, that reported paper profit is entirely fictitious. The business is burning physical liquidity to manufacture optical earnings.
The Three Weapons of Forensic Manipulations in India
Aggressive promoters in India employs three classic balance sheet maneuvers to fabricate the illusion of operating prosperity while cash flow bleeds away.
- First, channel stuffing and receivables inflation. When an Indian listed entity approaches quarterly reporting deadlines with uninspiring sales, management ships bulk products to compliant distributors, dealers or related parties. Revenue is recognized immediately on the Profit and Loss statement, artificially boosting the EBITDA. However, the cash is never collected. Instead, trade receivables swell and Days Sales Outstanding (DSO) stretches from a typical 60 days to 180 days or beyond. Under Ind AS 109, companies are required to take an Expected Credit Loss (ECL) allowance on aging receivables, but Indian promoters often delay the provisioning by claiming the accounts are fully collectible from prime clients. In reality, these are circular book entries designed to meet growth projections.
- Second, inventory hoarding and absorption costing manipulation. Under Ind AS 2, inventory must be valued at the lower of cost or net realizable value. When sales plummet, dishonest companies do not reduce manufacturing output. Instead, they run factories at high capacity, stockpiling unsold finished goods. By doing this, fixed overhead costs like plant depreciation, factory rent and labor are capitalized into the carrying cost of inventory on the balance sheet rather than flowing as period expenses through the income statement. This artificially lowers the Cost of Goods Sold on the income statement, engineering an optical spike in gross and EBITDA margins, while the working capital block turns the CFO deeply negative.
- Third, capitalizing operational expenses into Capital Work-in-Progress (CWIP). When an operating entity cannot disguise costs inside current assets, it routes day-to-day revenue expenditures into long-term capital assets. Running costs like staff salaries, software licenses, interest charges and administrative expenses are tagged as pre-operative expenses for an ongoing expansion project. This keeps operating expenses out of EBITDA, inflating the reported profit. Later, when the project is supposedly capitalized, the accumulated balance sits on the balance sheet under Property, Plant and Equipment, only to be written off or impaired a decade down the line.
The forensic Metric Framework
To separate legitimate compounding engines from accounting mirages, forensic investors must evaluate three primary ratios over rolling three-to-five-year cumulative periods.
Metric 1: The CFO to EBITDA Conversion Ratio.
This is the ultimate litmus test of earnings quality. It reveals how much of real operating cash a company extracts from every single rupee of reported operating profit. Cumulative CFO divided by Cumulative EBITDA. Threshold benchmarks:
- Greater than or equal to 0.80 represents institutional quality with excellent cash conversion.
- Between 0.70 and 0.79 represents acceptable baseline operations, standard for working-capital intensive industries.
- Between 0.50 and 0.69 represents caution, growing receivables, rising inventory drag or aggressive credit terms.
- Less than 0.50 represents severe forensic danger, over half of reported operating profit is trapped in working capital or non-cash paper claims.
Metric 2: The CFO to Profit After Tax (PAT) Ratio.
Since net profit comprises of non-cash depreciation charges, cumulative CFO should generally match or exceed cumulative PAT for an asset heavy business. Cumulative CFO divided by Cumulative PAT. Threshold benchmarks:
- Greater than 1.0 indicates a clean business where cash flow comfortably covers all net earnings.
- Between 0.80 and 1.0 indicates standard capital expenditure and tax leakage.
- Less than 0.80 sustained over three years points directly to aggressive revenue recognition or understated provisions.
Metric 3: The Cash Conversion Cycle (CCC).
The Cash Conversion Cycle measures the net number of days capital remains immobilized in the operating pipeline. Days Sales Outstanding plus Days Inventory Outstanding minus Days Payable Outstanding. Threshold benchmarks:
- A steady or declining cycle indicates pricing power and superior supply chain discipline.
- A cycle expanding by more than 30 days over a two year period signals channel stuffing, inventory obsolescence or vendors tightening credit due to counterparty distrust.
Data Comparisons across Financial Profiles
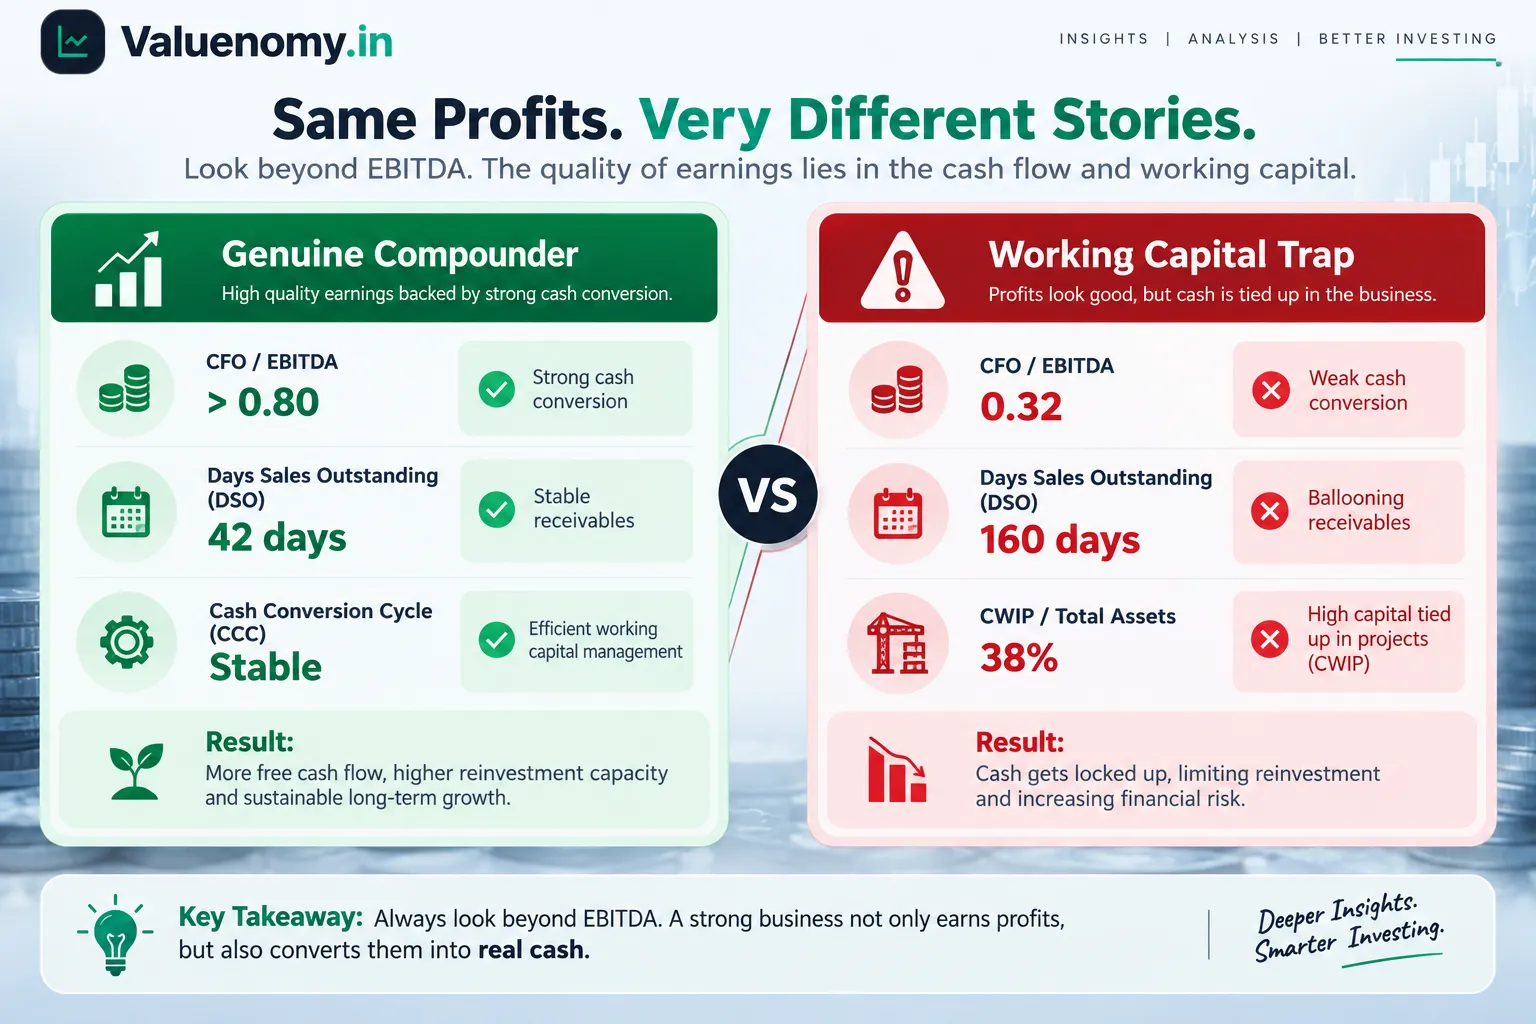
| Metric / Parameter | Profile A: Genuine Operating Compounder (High Cash Conversion) | Profile B: Working Capital Trap (Channel Stuffing Pattern) |
|---|---|---|
| Three year cumulative EBITDA | Rs 1,500 crore | Rs 1,200 crore |
| Three year cumulative CFO | Rs 1,320 crore | Rs 380 crore |
| CFO to EBITDA Ratio | 0.88 | 0.32 |
| Days Sales Outstanding | 42 days (stable) | Expanded from 65 days to 160 days |
| Days Inventory Outstanding | 55 days (stable) | Expanded from 70 days to 135 days |
| CWIP to Gross Block | 4 percent | 38 percent (persistent for four years) |
| Verdict | Pristine financial quality. Operating profit translates directly into investable liquidity, funding dividends and debt repayment without external capital dilution. | Severe red flag. Over 68 percent of reported operating profit vanishes into uncollected invoices and stockpiled inventory. Imminent credit downgrade or equity dilution risk. |
Step by Step Screening Framework for Retail Investors
- Step 1: Never accept single year numbers. Always pull minimum five year cumulative totals from annual reports to avoid cyclical distortion.
- Step 2: Calculate the cumulative CFO to EBITDA ratio. If the cumulative ratio over five years falls below 0.70, disqualify the business from premium valuation multiples.
- Step 3: Analyze the Working Capital Bridge in the Cash Flow Statement. Inspect the change in trade receivables and inventory. If working capital adjustments are consistently negative year after year, the business is giving away product on uncollectible credit terms.
- Step 4: Cross-verify CWIP against commissioning timelines. Check the notes to accounts for CWIP aging schedules as mandated by the revised Schedule III of the Companies Act, 2013. If projects are running past cost and time overruns exceeding two years, operating expenses are likely being capitalized.
- Step 5: Verify real economic fair value. Factor true cash flows rather than optimistic EBITDA into financial models. Retail investors should plug genuine operating cash flows into Valuenomy's Fair Value Calculator to see how severely bloated working capital erodes actual intrinsic value.
Sources
Forensic analysis must be cross-referenced to institutional governance guidelines in India.
The Institute of Chartered Accountants of India (ICAI) Ind AS 7 establishes statutory standards for cash flow disclosures, requiring rigorous segregation of operating, investing and financing flows without room for operating window dressing.
The Securities and Exchange Board of India (SEBI) Listing Obligations and Disclosure Requirements (LODR) Regulations mandate granular related party disclosures and statutory audit qualifications regarding asset recoverability.
The Reserve Bank of India (RBI) Prudential Norms on Income Recognition, Asset Classification and Provisioning govern banking channel exposures and working capital limits.
Ministry of Corporate Affairs (MCA) Schedule III compliance norms require mandatory aging disclosures for trade receivables and CWIP.
National Financial Reporting Authority (NFRA) audit quality oversight reviews penalize aggressive accounting policies and improper expense capitalization.
- https://www.icai.org/
- https://www.sebi.gov.in/
- https://www.rbi.org.in/
- https://www.mca.gov.in/
- https://nfra.gov.in/
Frequently Asked Questions
What does a CFO to EBITDA ratio below 0.50 indicate?
It indicates that less than half of reported operating profit turns into cash, signaling acute working capital blockage or aggressive revenue recognition.
Can a company report strong positive EBITDA and go bankrupt?
Yes, the company can go bankrupt as EBITDA does not indicate debt servicing, taxes and working capital needs, which are critical elements of liquidity.
Why do companies capitalize into CWIP?
Promoters route recurrent overheads into CWIP to keep them off the profit and loss account, artificially pumping EBITDA and net income.
How do you check if rising receivables are genuine or channel stuffing?
Compare the revenue growth rate with trade receivables growth, if receivables grow significantly faster alongside expanding DSO, channel stuffing is occurring.
How does working capital drag impact intrinsic valuation?
Persistent working capital drag severely diminishes free cash flow to equity, leading to massive downward revisions in intrinsic fair value calculations.

Valuenomy Research
Capital Markets & Valuation DeskValuenomy Research Desk is comprised of certified financial analysts focusing on DCF valuation modeling, Indian direct taxation analysis, and quantitative equity risk management.
View Editorial Profile & MethodologyRegulatory Compliance & Statutory Disclaimer
The financial models, valuation projections, brokerage summaries, and target estimations presented on Valuenomy are curated solely for academic research, mathematical evaluation, and investor education purposes.
Valuenomy is not a SEBI-registered investment advisor or research analyst. Securities markets are subject to high market risks. Always review underlying corporate filings and consult an authorized SEBI-registered financial advisor before executing capital decisions.